I will continue to build on my earlier posts about my COVID19 Dashboard. In this series, I am
writing a few different blog articles describing not only how I built it, but
some things I learned in the process.
The current list of planned topics include:
PART 3 – Adding some
key measures
In my earlier posts, I spent time explaining where I
acquired the data and some key steps I took in transforming the data into the
data model. In this post, I will explain
some of the DAX I used to create some of the key measures for the
visualizations. One of the first steps
in design is to identify what questions you are trying to answer or the story
you are trying to tell with your visualizations and reports. In thinking about everything going on with
Covid 19, I felt it was not only important to know how many total cases and
total deaths, but I wanted to understand how the numbers were changing daily.
- What was the rate of increase?
- Is it increasing faster today than it did
yesterday?
- How long did it take for cases to double?
- How long until they double again?
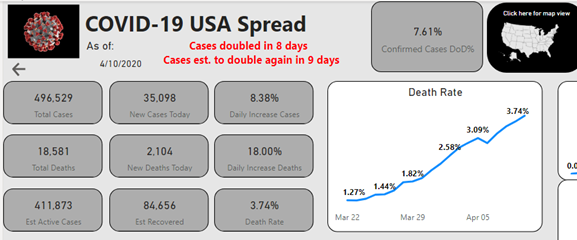
Let’s look at four of the measures that are used in this dashboard.
- Daily increase cases
- Confirmed cases DoD%
- Cases double in
- Cases est. to double again
Daily
increase cases – this measure looks at the percent of change between the new
cases each day. This is a percent
increase math problem. Percent Increase
= (today’s new cases – yesterday’s new cases) / yesterday’s new cases. So, to calculated this in DAX, we need today’s
cases amount and yesterday’s cases amount.
Since today’s cases will be the maximum date in the data, I used the
following DAX formulas to calculate today’s and yesterday’s cases.
First,
I crease a Sum Cases measure so I could reference it in other measure.
Sum Cases
= sum('US Covid Activity'[Daily Cases])
New Cases Today =
CALCULATE([Sum Cases],FILTER(ALL('Date'),'Date'[Date]=MAX('Date'[Date])))
New Cases Yesterday =
CALCULATE([Sum Cases],FILTER(ALL('Date'),'Date'[Date]=MAX('Date'[Date])-1))
Once I had the cases I could use a
simple DIVIDE function.
Daily Increase Cases =
DIVIDE([New Cases Today]-[New Cases Yesterday],[New Cases Yesterday],0)
Confirmed
cases DoD% - this measure looks at the day of day percent growth in total
cases. This is also a percent increase
math problem. Percent Increase = (today’s
total cases – yesterday’s total cases) / yesterday’s total cases.
In this case, I used a Variable to
calculate the Previous Day
Confirmed Cases DoD% =
//Calculate Day of Day % of change
//Set variable for Prior day Life to Date total
VAR __PREV_DAY =
CALCULATE(
SUM('US Covid
Activity'[Daily Cases]),
DATEADD('Date'[Date],
-1,DAY)
)
//Calculate Net Change in cases (Today LTD less Yesterday LTD)
//Divided by Yesterday LTD
RETURN
DIVIDE(
SUM('US Covid Activity'[Daily
Cases]) - __PREV_DAY,
__PREV_DAY
)
Cases Doubles In – This measure looks back in time to see how many days it has taken
to double the number of cases. For
example, if today’s total cases are 100,000, then how many has it been since
the cases were 50,000. This seemed to be
a complex problem, but fortunately an internet search did not let me down. I was able to find a close example at https://www.thebiccountant.com/2020/03/22/calculating-doubling-times-with-dax-in-power-bi/ I had to make some slight changes to the
example provided to get it to work in my scenario. Below is the code I used.
Doubled in Days =
//SET THE CURRENT DATE
VAR CURRENTDAY = MAX('US Covid Activity'[Date])
// GET HALF OF TODAYS VALUE
VAR THRESHOLDVALUE =
CALCULATE(SUM('US Covid Activity'[Confirmed
Cases]),'US Covid Activity'[Date]=CURRENTDAY) / 2
//Get the day when the number of cases was half as much as today
//FILTER returns dates at which the total sum of confirmed cases
was below the threshold
VAR DayOfHalf =
CALCULATE(MAXX('US Covid Activity','US Covid
Activity'[Date]),FILTER(ADDCOLUMNS(SUMMARIZE(ALL ('US Covid
Activity'),'US
Covid Activity'[Date]), "AMOUNT",CALCULATE(Sum('US Covid
Activity'[Confirmed Cases]))),[AMOUNT]<=THRESHOLDVALUE))
//Calculated the date difference between today and the date the
amount was half
VAR DoublingTime = DATEDIFF(DayOfHalf,CURRENTDAY,DAY)
RETURN
DoublingTime
The formula for doubling time is LN(2)/LN(1 + i).
- The (i) is the rate (confirmed cases
DoD%).
- LN returns the natural
logarithm of a number.
The DAX formula was
Est. Days to Double =
ROUND(DIVIDE(ln(2),ln(1+[Confirmed Cases DoD%])),0)
Note- I used the Round
function to round to the nearest whole day.
I also created these measures for the global cases table in my data model.
In my next article, I will look at some additional measures I created around U.S. population.


Comments
Post a Comment