I will continue to build on my earlier posts about my COVID19 Dashboard. In this series, I am writing
a few different blog articles describing not only how I built it, but some
things I learned in the process.
The current list of planned topics include:
- Working with growing CSV files
- Using index and merge when transforming data
- Using time functions to calculate the daily
change
- Reporting based on the population
- Working with maps, setting data types correctly
- Possibly more to come depending on how long this
all goes….
PART 2 – Continuing
to transform the data
In my first post, I explained how I brought in data from a
CSV file and used “Unpivot Columns” to transform the data into a format that
works much better for reporting. Once
the data was in this format, I quickly noticed that the values (Cases, Deaths
and Recoveries) were cumulative. In
other words, these amounts were ending balances not daily transactions, if I
look at it as an accountant. These
balances were going to make my ideas for reports more difficult, since I wanted
to see the change day over day, net change over day, etc.
Sample File
County-State
|
Date
|
Confirmed Cases
|
Orange,
California
|
3/15/2020
|
14
|
Orange,
California
|
3/16/2020
|
17
|
Orange,
California
|
3/17/2020
|
22
|
Orange,
California
|
3/18/2020
|
29
|
Orange,
California
|
3/19/2020
|
53
|
Desired File
County-State
|
Date
|
Confirmed Cases
|
Daily Cases
|
Orange,
California
|
3/15/2020
|
14
|
14
|
Orange,
California
|
3/16/2020
|
17
|
3
|
Orange,
California
|
3/17/2020
|
22
|
5
|
Orange,
California
|
3/18/2020
|
29
|
7
|
Orange,
California
|
3/19/2020
|
53
|
24
|
So, I started my normal approach to problem solving for
Power BI, I did an internet search. I
was looking for “combining rows in Power Query” or “add column power bi from
previous row”. I found a tutorial on ExcelTown
that helped me solve the problem.
Step by step solution
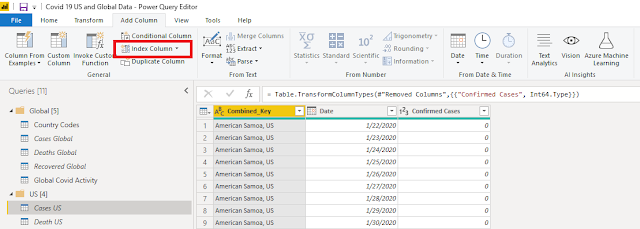
Step 1 – Add an
index column to my data
Step 2 - Add an additional column add 1 to the index column
Step 3 – Since my
data has repeated dates (one date for each county and state combination (my
Combined_Key column), I needed to add some additional keys for the future merge
that I was going to do, because I only want to look at the prior row, if it is
the same county and state combination.
To do this, I simply added to new columns. The first one combined Combined_Key with
Index and the second one combined Combined_Key with Addition.
·
Merged
column = Table.AddColumn(#"Inserted Addition", "Merged",
each Text.Combine({[Combined_Key], "-", Text.From([Index],
"en-US")}), type text)
·
Merged
column2 = Table.AddColumn(#"Inserted Merged Column",
"Merged.1", each Text.Combine({[Combined_Key], "-",
Text.From([Addition], "en-US")}), type text)
Step 4 - Once the
keys were in place, I used Merge to merge the table with itself.
Step 5 – Now I can
bring in the Confirmed Cases from the prior row by clicking on the doublesided
arrow at the header and show the value from the connected query.
Step 6 – I removed
all the index and key columns that are no longer needed and renamed my new
column from the prior day to Prior Confirmed Cases.
Step 7 – I added
a new column to calculate net change (Confirmed Cases – Prior Confirmed Cases) Table.AddColumn(#"Renamed
Columns2", "New Cases", each [Confirmed Cases]-[Prior Confirmed
Cases])
I repeated these steps with other tables, so I had net
change in every table. I also used merge
to combine Cases data with Death data, so I had a simpler data model when I work
with visualizations.
In my next article, I will move away from Power Query and
into DAX to discuss some of the measures I created in the report.


Comments
Post a Comment